Gateway Client Settings
5 minute read
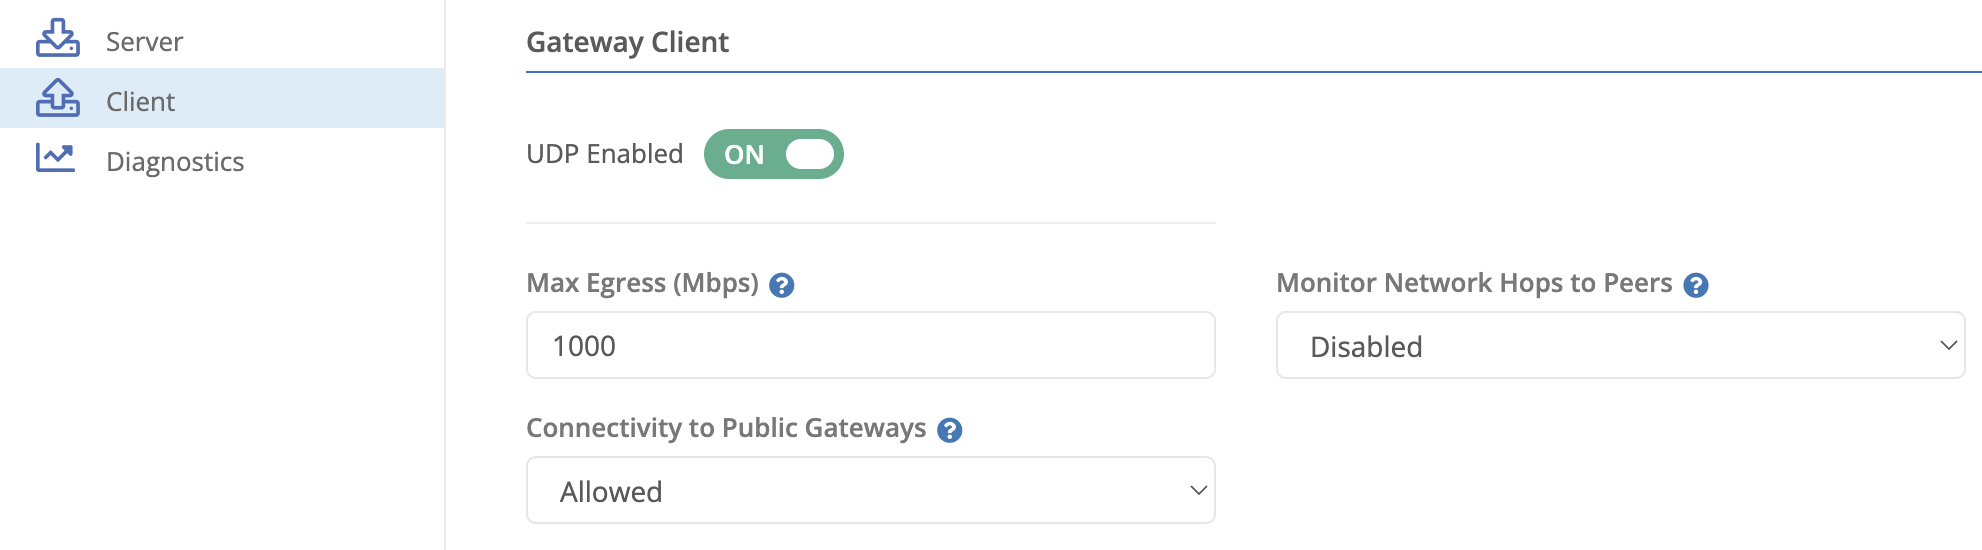
Settings on this page determine how a node’s client connection to gateway peers behave.
Settings
| Field Name | Description |
|---|---|
| Connectivity to Public Gateways | Options are Allowed or Denied. If set to Denied this will cause the node to not attempt connections to public gateways. This might be desired if you want the node to only connect to configured private gateways. Or if you have private gateways that do not need to connect to the public gateways in your organization. |
Hop Monitoring Settings

| Field Name | Description |
|---|---|
| Monitor Hops to Gateway Servers | Determines if the node will attempt to monitor hops to gateway peers. The possible values are:
|
| Monitor Hops Protocol | The protocol used to probe each hop. Requires the June 2026 release or later.
|
| Monitor Hops Interval | The interval time, in seconds, between gathering hop monitoring data. Default is 20s. |
| Support Monitor Hops Resets | Determines if the node will send reset (RST) packets for the TCP connections it attempts. Doing so reduces, but does not eliminate the number of resets seen on the WAN interface.
|
| Monitor Hops SYN Payload Size | Determines the size of the TCP SYN payload sent. By default the payload is 0. Can be set between 0 and 1440. Recommended max is the lower of 1440 or the WAN MTU minus 60 bytes. |
Gateway Latency Monitors
A gateway latency monitor watches the round trip time (RTT) of the node’s tunnel to a gateway and reacts when it exceeds a threshold. RTT is the time a packet takes to travel to the gateway and back. The purpose is to let a cluster member mark itself unhealthy when its tunnel latency to a gateway gets too high, triggering a failover to a healthier member. If the node is not in a cluster, the monitor still sends a Gateway Latency Exceeded event, but traffic stays on the node.
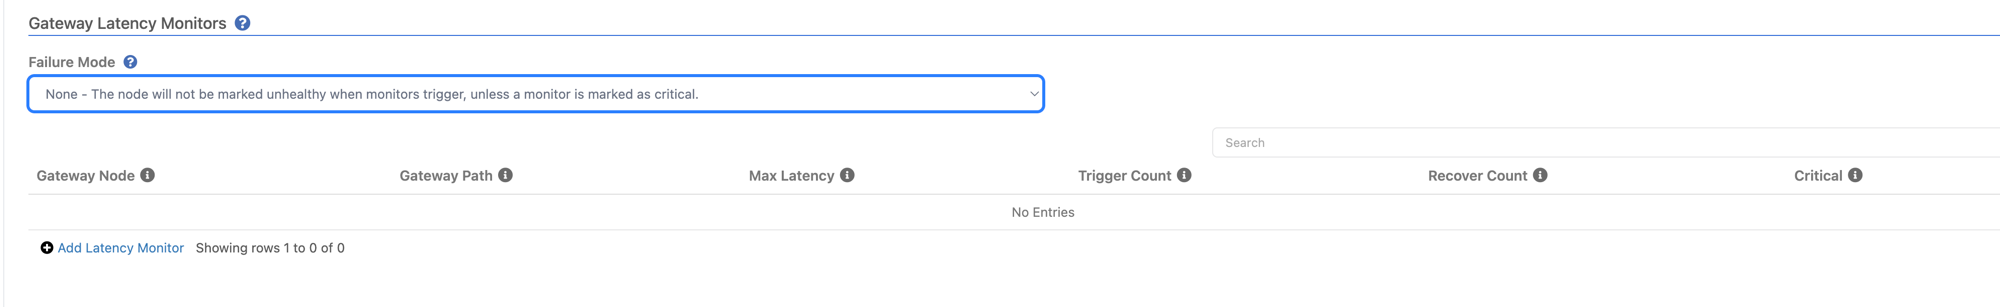
Failure Mode
Determines how triggered monitors affect the node’s health:
- None - The node is not marked unhealthy when monitors trigger, unless a monitor is marked as Critical. This is the default.
- Any - The node is marked unhealthy when any single monitor triggers. All monitors must recover before the node becomes healthy again.
- All - The node is marked unhealthy only when every monitor is triggered. The node recovers as soon as any single monitor recovers.
Monitor Fields
Use Add Latency Monitor to add a monitor.
| Field Name | Description |
|---|---|
| Gateway Node | The gateway to monitor latency to. |
| Gateway Path | (Optional) A specific gateway path to use for the monitor. Configure this if you want to monitor latency over a second path. |
| Max Latency | The maximum acceptable latency, in milliseconds, for the monitor. |
| Trigger Count | The number of consecutive RTT values that must be above the Max Latency before the monitor triggers. |
| Recover Count | The number of consecutive RTT values that must be below the Max Latency before the monitor marks itself healthy again. |
| Critical | When enabled, the monitor is treated as essential. Its failure alone marks the node unhealthy, and the node cannot recover until this monitor recovers, regardless of the Failure Mode setting. |
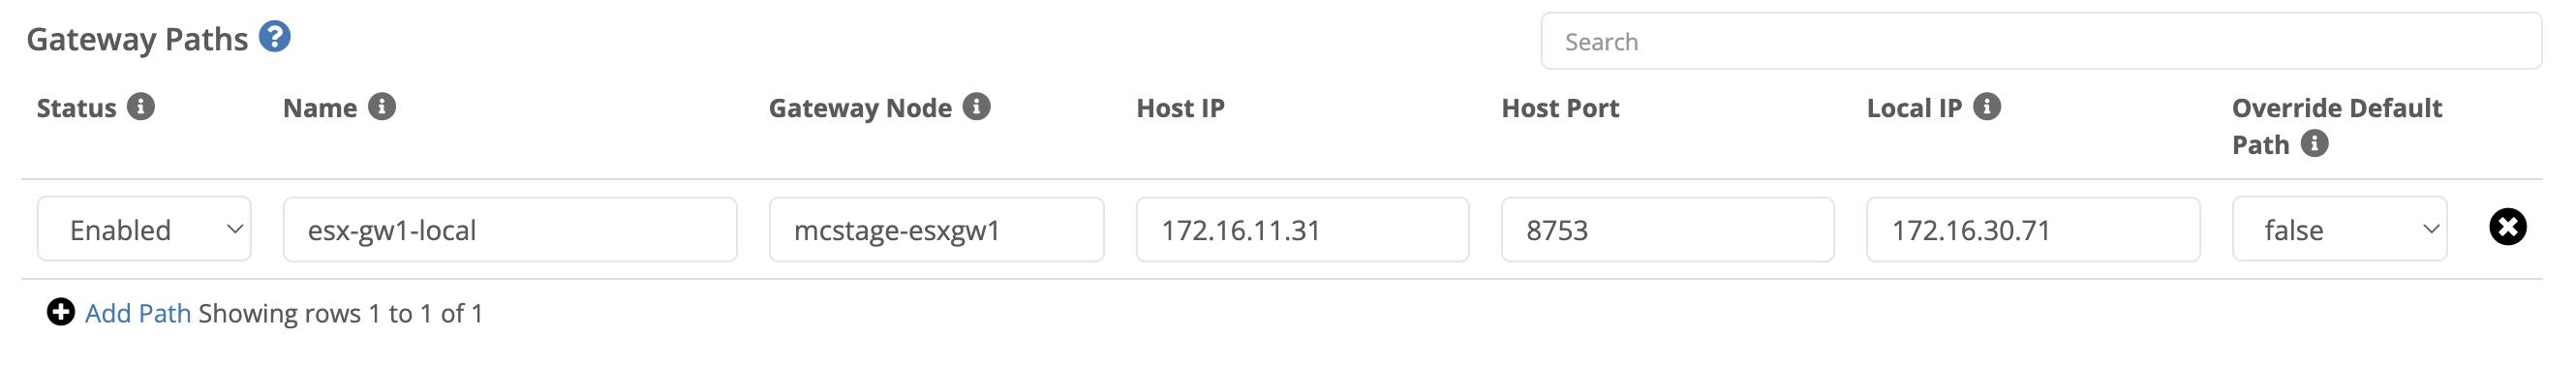
Gateway Paths
Allows you to define alternate paths to a gateway server
| Field Name | Description |
|---|---|
| Status |
|
| Name | A name for the path. |
| Gateway Node | Gateway for which the path is applicable. |
| Host IP | Destination IP address for the path. |
| Host Port | Destination port for the path. |
| Local IP | Use this local IP as the source IP for the connection to the gateway. |
| Use as Default |
|
Add A Gateway Path
- Click the Add Path link
- Fill in the fields as desired.
- Click the green check mark to save the path.
- Optionally, repeat with additional paths.
- Click save.
Delete a Gateway Path
- Click the X to the right of the desired path.
- Click save.
Feedback
Was this page helpful?
Glad to hear it! Please tell us how we can improve.
Sorry to hear that. Please tell us how we can improve.