Setting up Grafana Cloud for OpenTelemetry Export
This guide walks you through configuring Grafana Cloud and the Trustgrid Portal to export OpenTelemetry (OTEL) data.
3 minute read
Early Access Notice
The Observability feature is currently in early access. We are actively gathering feedback and usage data to help determine if additional charges will apply in the future. Functionality and pricing are subject to change.To enable this feature for your account, please contact Trustgrid Support.
This guide will walk you through configuring Grafana Cloud to receive OpenTelemetry data from the Trustgrid Observability feature.
Part 1: Configure Grafana Cloud to Receive OTEL Data
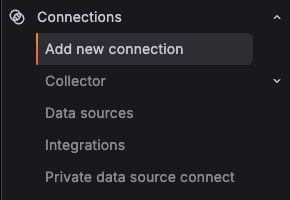
Step 1: Add a New Connection
- From the Grafana Cloud Navigation Menu, select Connections –> Add new connection
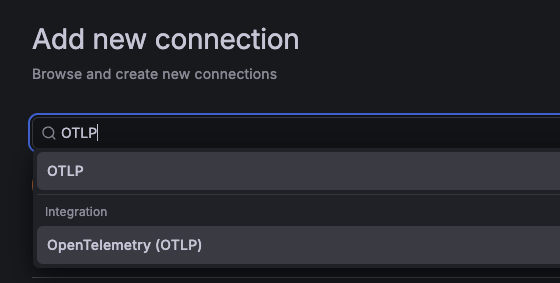
Step 2: Search for OpenTelemetry (OTLP)
- In the Search Connections box, search for
OTLP - Select OpenTelemetry (OTLP) from the results
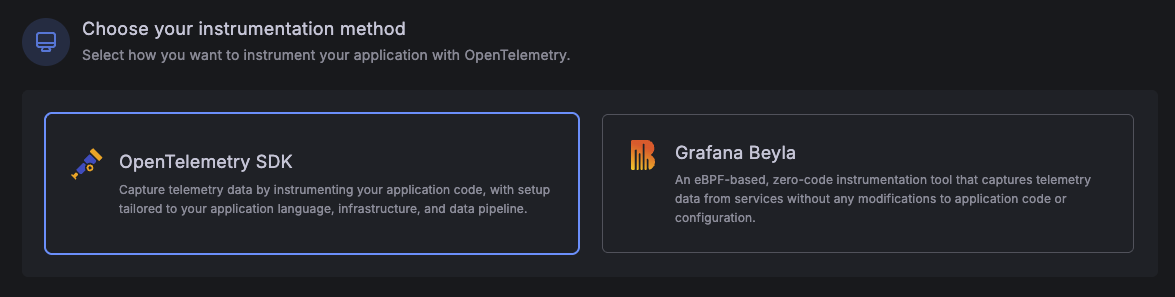
Step 3: Choose Your Instrumentation Method
- Under Choose your instrumentation method, select OpenTelemetry SDK
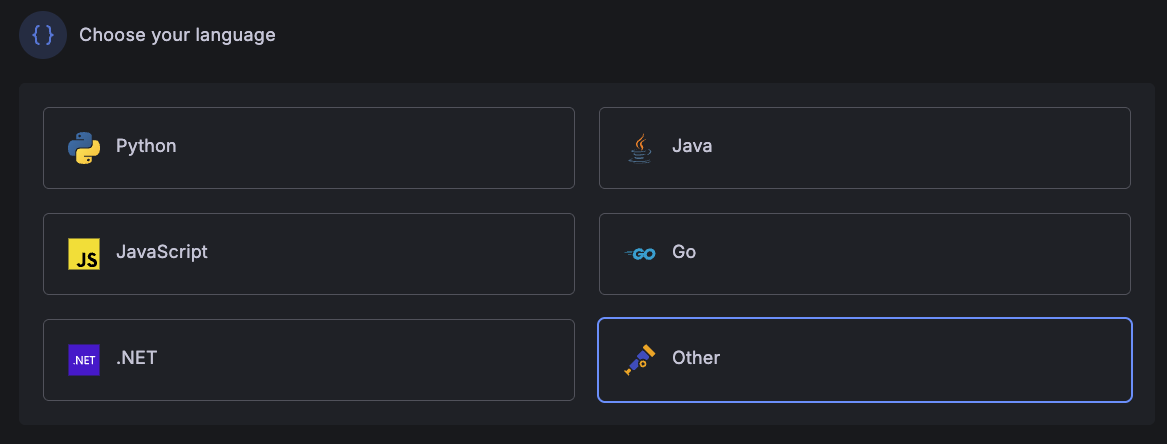
Step 4: Choose Your Language
- Under Choose your language, select Other
- Click Next
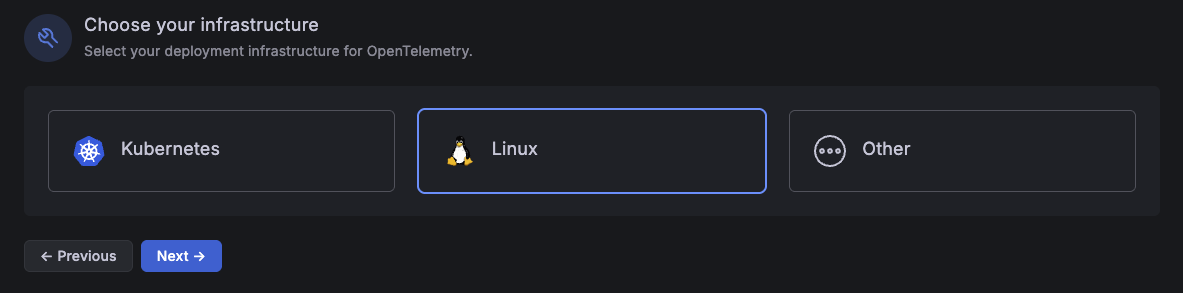
Step 5: Choose Your Infrastructure
- Under Choose your infrastructure, select Linux
- Click Next
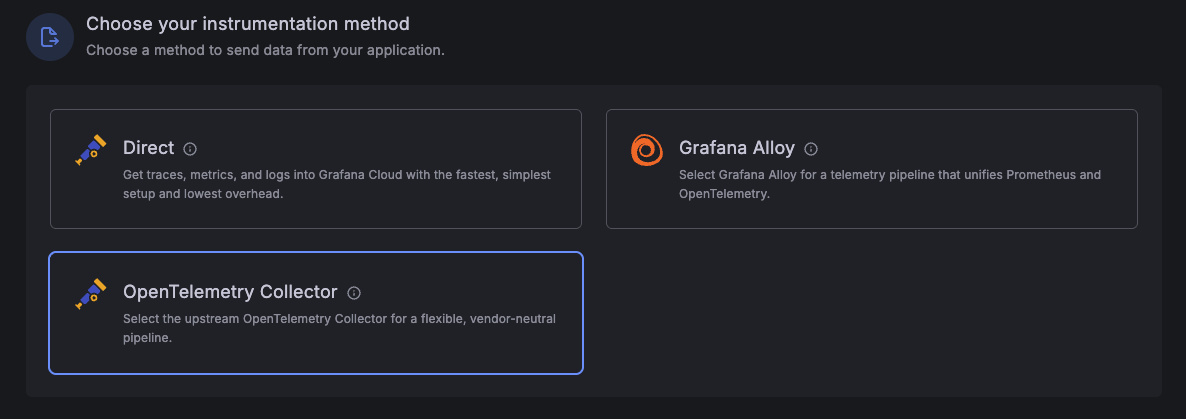
Step 6: Choose Your Instrumentation Method
- Under Choose your instrumentation method, select OpenTelemetry Collector
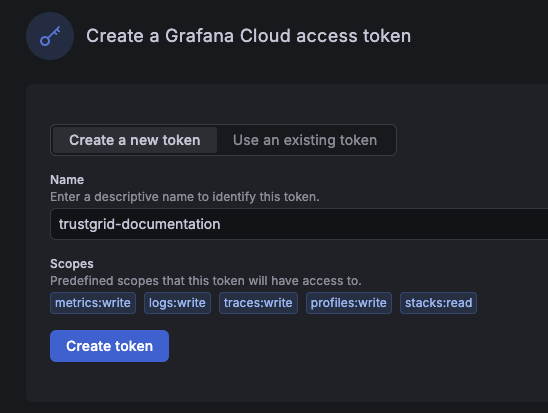
Step 7: Create a Grafana Cloud Access Token
- In the Create a Grafana Cloud access token box, enter a name for your new token
- Click Create token
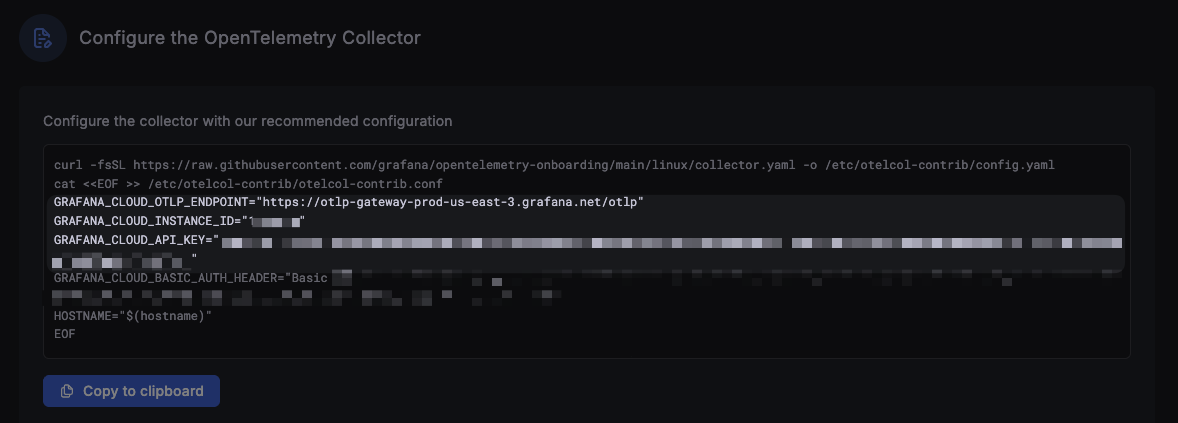
Step 8: Note Your Configuration Values
- Scroll down to the section labeled Configure the OpenTelemetry Collector
- Make note of the following values – you will need them to configure your exporter in the Trustgrid portal:
GRAFANA_CLOUD_OTLP_ENDPOINTGRAFANA_CLOUD_INSTANCE_IDGRAFANA_CLOUD_API_KEY
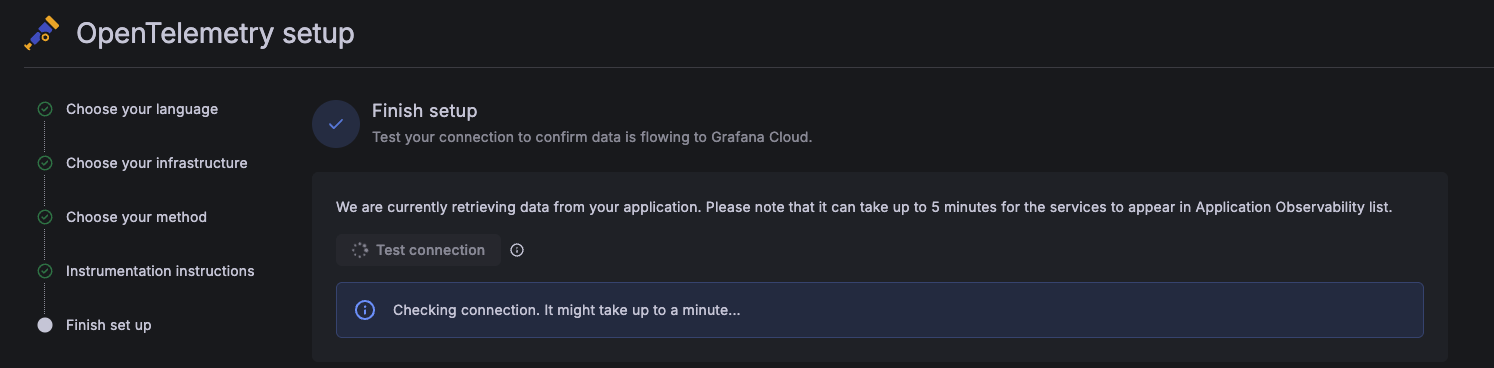
Step 9: Finish Setup (Optional)
- Select Next until you reach the Finish set up screen. This will begin watching for OTEL data being sent to Grafana Cloud from your exporter.
Part 2: Configure the Trustgrid OTEL Exporter
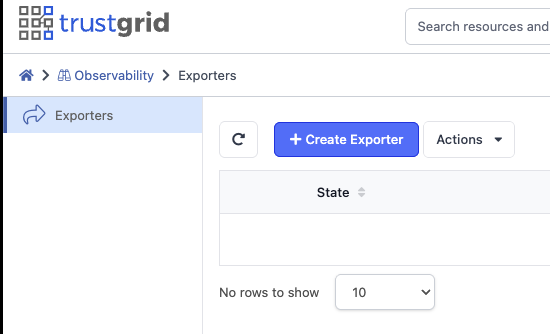
Step 10: Navigate to Observability and Create an Exporter
- In the Trustgrid Portal, navigate to Observability
- Click + Create Exporter
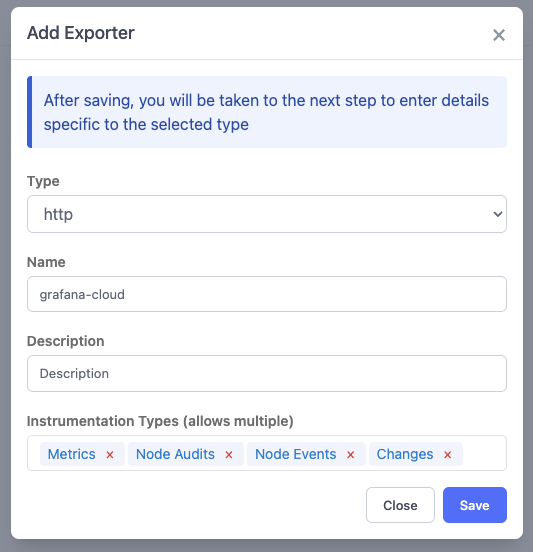
Step 11: Add Exporter Details
- In the Add Exporter dialog:
- Set the Type to
http - Enter a Name for your exporter
- Select the Instrumentation Types you want to send to Grafana Cloud
- Set the Type to
- Click Save
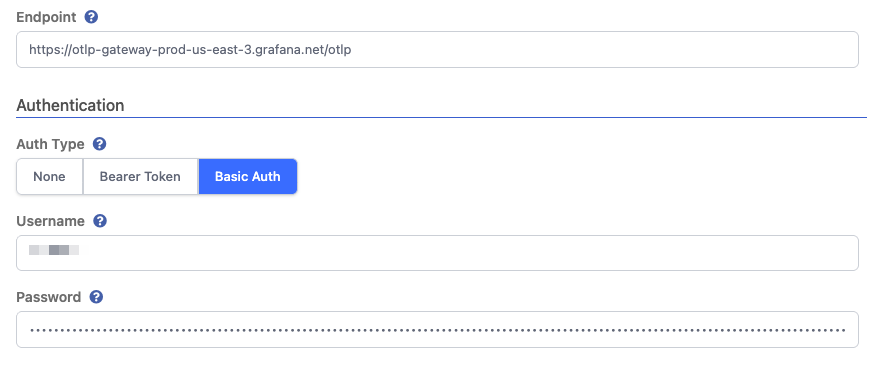
Step 12: Configure the Exporter
- In the exporter configuration screen:
- Set the Endpoint to the value from
GRAFANA_CLOUD_OTLP_ENDPOINTnoted in Step 8 - Under Authentication, select Basic Auth
- Set the Username to the value from
GRAFANA_CLOUD_INSTANCE_ID - Set the Password to the value from
GRAFANA_CLOUD_API_KEY
- Set the Endpoint to the value from
- Click Save
Your Grafana Cloud OpenTelemetry configuration is now complete. You should begin seeing the instrumentation types you selected flowing into Grafana Cloud.
Sample Dashboard
Trustgrid provides a sample Grafana dashboard that visualizes key node metrics exported via OTEL. You can import it directly into your Grafana instance from the Grafana dashboard library:
To import it:
- In Grafana, go to Dashboards –> Import
- Enter the dashboard ID
25256or paste the URL above - Click Load, select your Prometheus/Mimir datasource, and click Import
Feedback
Was this page helpful?
Glad to hear it! Please tell us how we can improve.
Sorry to hear that. Please tell us how we can improve.